 跳到内容
跳到内容 
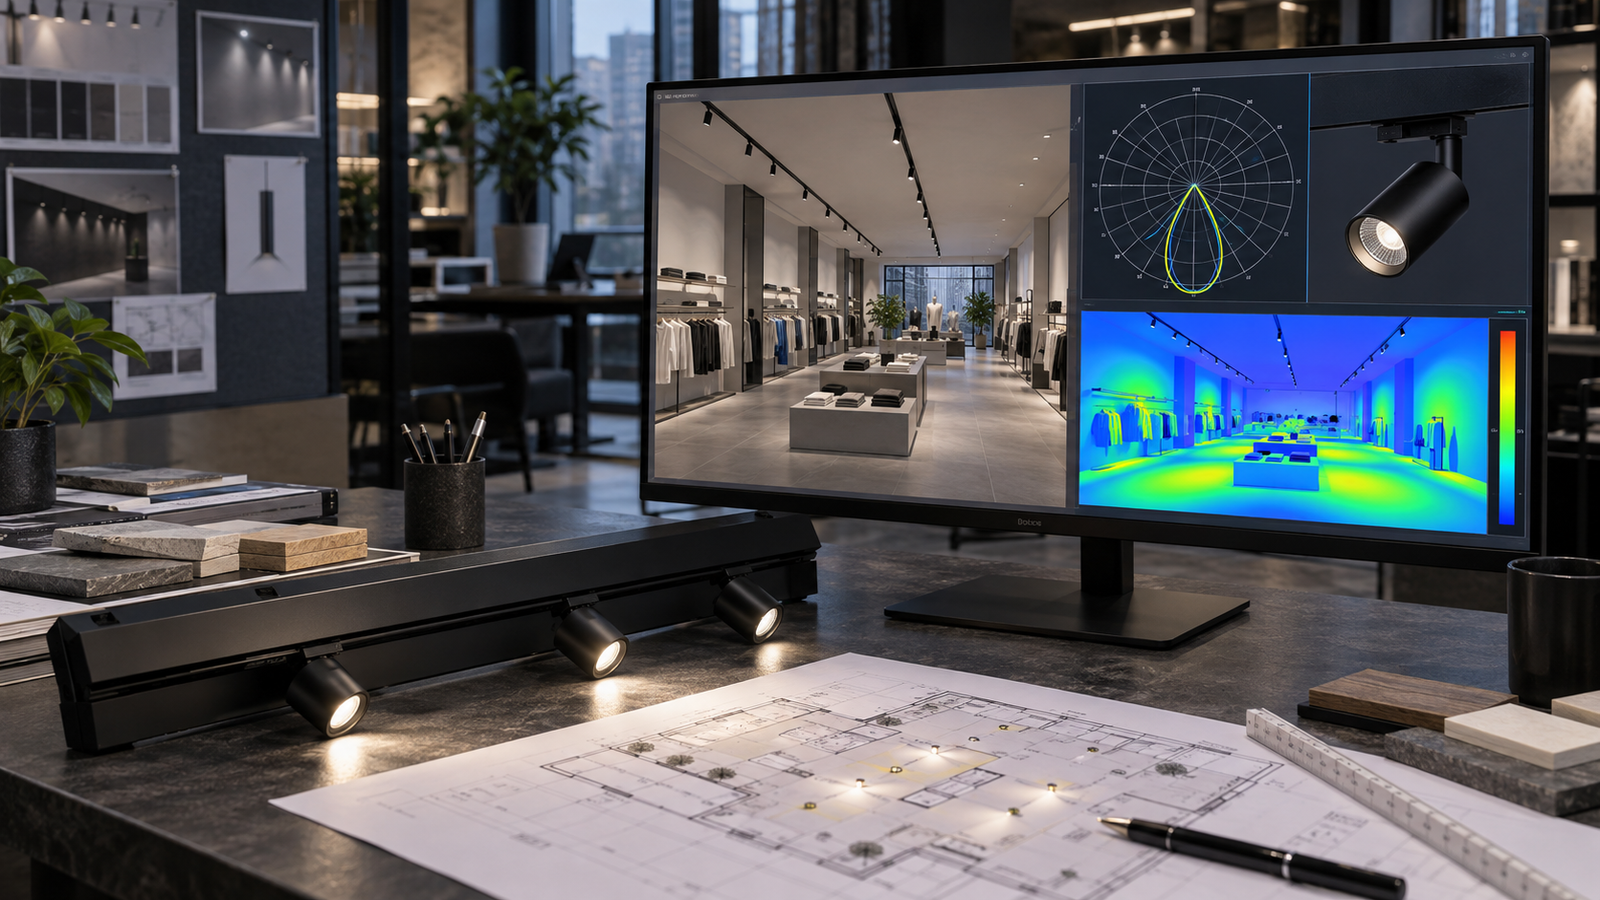
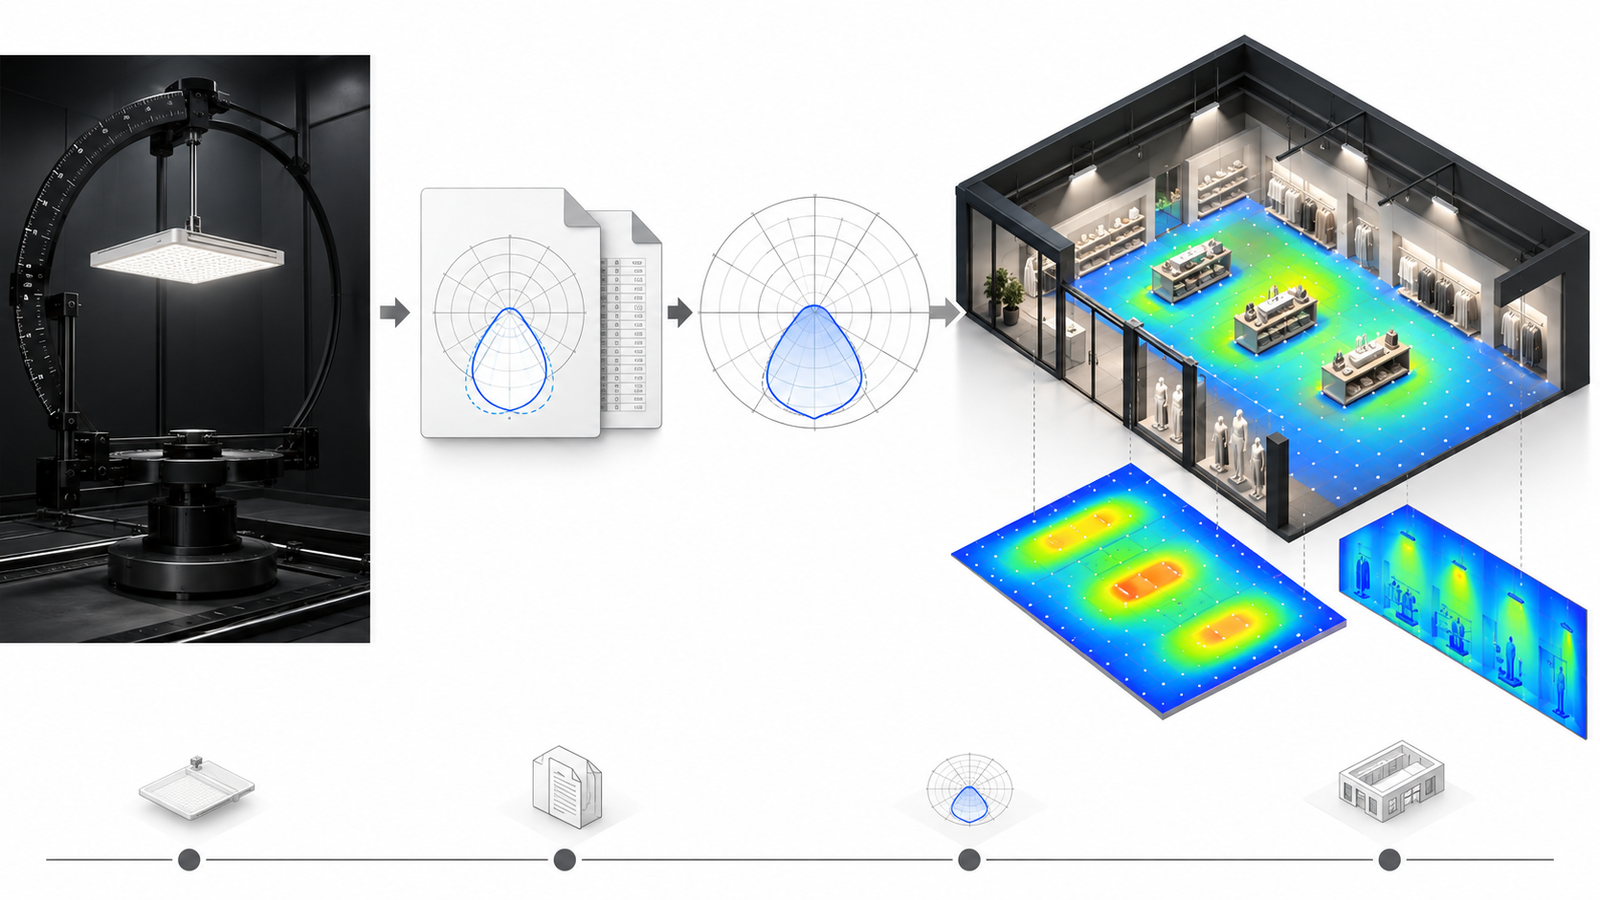
A PDF showing lumens and beam angle cannot tell a lighting designer where the light goes. An IES or LDT photometric file can. These files contain measured luminous-intensity distribution and related information that calculation software uses to predict illuminance, uniformity and visual patterns in a project model.
However, the presence of a file does not prove that it matches the product you will receive. This guide explains the practical difference between IES and LDT, what to check inside a file and how buyers can connect photometric data to samples and production.
What an IES file is
An IES file is a standardised plain-text format for transferring photometric data. The Illuminating Engineering Society identifies ANSI/IES LM-63 as the standard file format used for electronic transfer of photometric data and related information. The file can include luminaire identification, dimensions, lamp or source information, luminous intensity values and measurement geometry.
Lighting software imports the data and represents the luminaire in a model. The file is not a rendered image; it is a structured dataset. Because it is text, a competent reviewer can open it and inspect header information, although full interpretation normally occurs in photometric software.
What an LDT file is
LDT commonly refers to the EULUMDAT format used widely in Europe. It also transfers luminaire intensity distribution and descriptive information for lighting calculations. IES and LDT differ in structure, conventions and metadata, but both serve the practical goal of communicating how a luminaire distributes light.
Many professional programs can import both. The buyer should request the format required by the project team rather than converting repeatedly without checking the result. Conversion can be useful, but the original laboratory data and source file should remain traceable.
Neither format is automatically more accurate
Accuracy depends on the measurement, laboratory, equipment, sampling, product configuration and file preparation—not merely the extension. A carefully measured LDT file can be more useful than an IES file copied from a similar product, and vice versa.
Ask who measured the luminaire, which test method was used, when it was tested and whether the file was created directly from the report. Independent accredited laboratory data may be required for some projects, while factory photometry may be acceptable for development or preliminary design. State the requirement.
Match the file to the exact model
Check model, wattage, optic, CCT, CRI, driver current, diffuser or louvre, length and control setting. A 60° and 90° optic need separate files. A high-CRI option may have different output. A selectable-wattage luminaire needs data or a documented scaling approach appropriate to each setting.
Do not rename a file to the purchased model without proving equivalence. The photometric header, report and quotation should tell the same story.
Review complete-luminaire lumens
Photometric files may contain a lamp lumen basis, absolute photometry or multipliers depending on format and product. Confirm whether the intensity data represents the complete luminaire output. Compare integrated file lumens with the test report and catalogue value, allowing only documented tolerances.
If software applies an incorrect multiplier, the calculated lux can be wrong even when the distribution shape looks plausible. Ask the lighting designer to verify imported output before building the layout.
Understand the polar distribution
A polar curve shows intensity by angle in one or more planes. A narrow concentrated shape indicates more intensity in a smaller angular range; a broad shape indicates wider spread. Asymmetric or wall-washing products may show different curves in perpendicular planes.
Do not judge a complex linear fixture from one curve image. Review all relevant C-planes or the 3D distribution. A dual-panel product may require separate panel data, combined data at a reference setting or a modelling method that represents each panel’s orientation.
Luminous dimensions affect glare and modelling
File formats include geometric information about the luminous opening. These dimensions affect how software represents source size and can influence glare calculations or near-field behaviour. Check that length, width, height and luminous area match the product drawing.
For long linear luminaires used close to shelves, a simple point-source approximation may introduce limitations. The designer should understand the calculation software’s model and decide whether more detailed data or sub-luminaire representation is needed.
Coordinate systems and orientation matter
A correct file can produce a wrong design if imported or rotated incorrectly. Check the photometric coordinate system, luminaire orientation, zero direction and aiming convention. In track lighting, the physical adapter direction and software symbol should align with the intended target.
For asymmetric distributions, include a drawing showing the file orientation relative to the luminaire body. Mark the front, panel direction or wall side. Installers then need a corresponding site reference.
Use vertical calculation planes
Retail designs often calculate only the floor, which can make an aisle appear satisfactory while lower shelves remain dark. Add vertical grids on shelf faces, feature walls and signs. Review average, minimum, maximum and uniformity rather than one centre value.
For a two-sided aisle, create a grid on each shelf face. If one adjustable fixture serves both directions, model each panel or approved combined orientation accurately.
Add realistic reflectances and obstructions
Ceiling, wall, floor, shelf and merchandise reflectances affect interreflected light. Generic bright surfaces can overstate performance in a dark store. Tall shelves, signage and architectural elements can block beams. Build a representative model, not an empty white box.
Use sensitivity checks when finishes are uncertain. Compare a reasonable light and dark condition to see whether the design has enough margin.
False-colour plots need context
A false-colour image is excellent for finding hot spots and dark zones, but its scale can be adjusted to make almost any design look attractive. Always display the range, calculation grid and numeric summary. Compare alternatives using the same scale.
Renderings are visual aids, not measurements. A photorealistic view can hide calculation assumptions. Keep tables, contour plots and file references with the images.
Check maintenance factors
Calculation results may be initial or maintained. Ask what maintenance factor is applied and how it accounts for lumen depreciation, dirt and room conditions. A project that meets the target only at day one may become underlit before planned maintenance.
Apply factors consistently when comparing suppliers. Do not reduce one product’s result and leave another at initial output.
Photometric files cannot show every quality issue
An intensity distribution does not fully describe flicker, colour quality, driver noise, physical glare from visible LED images, finish, thermal performance, mechanical fit or manufacturing consistency. It also cannot prove track-adapter compatibility.
Use photometric files for layout decisions and combine them with spectral data, temporal-light measurements, drawings, reports and a real sample.
How to validate the file with a sample
- Freeze the exact sample configuration.
- Measure input power and complete-luminaire output where required.
- Install it at known height and orientation.
- Create a simple grid on floor and vertical targets.
- Measure points with a calibrated instrument.
- Model the same geometry using the supplied file.
- Compare pattern and values within realistic measurement and modelling tolerances.
- Investigate orientation, multipliers, reflectance and sample differences.
The goal is not perfect identity at every point. It is to confirm that the file represents the product well enough for design decisions and that large discrepancies are explained before mass production.
Questions buyers should ask
- Which laboratory created the file and report?
- What test method and equipment were used?
- Is this IES or LDT file original or converted?
- Which exact model, optic, wattage, CCT and CRI does it represent?
- Does it use absolute photometry or a lumen multiplier?
- Do file lumens agree with the report?
- Are luminous dimensions and orientation correct?
- How should adjustable panels be modelled?
- Is a separate file available for each optic and power setting?
- What production tolerance and change control apply?
How to handle dual-panel photometry
Ask whether the supplier has measured the combined fixture with panels at a defined reference angle, each panel separately, or both. A combined file at one angle cannot be rotated independently inside ordinary software unless the designer has an appropriate method. Separate panel files can offer flexibility but must use correct lumen allocation and geometry.
The LL1615 adjustable LED linear track light has independent panel tilt and 60° or 90° options. Project modelling should state the exact panel orientation and optic. Final aiming still needs a site mock-up.
File naming and revision control
Use a filename that includes model, wattage, optic, CCT or CRI where they affect output, test date and revision. Maintain a simple register linking the file to report number and product drawing. If the optic, LED, driver current or geometry changes, assess whether a new file is required.
Remove obsolete files from public download areas or mark them clearly. Designers may save local copies for years, so communicate revisions to active projects.
What to include in the RFQ
- Required IES, LDT or both formats
- Exact configuration list
- Laboratory and test-method expectation
- Complete-luminaire lumen basis
- Luminous dimensions and orientation drawing
- Adjustable-part modelling approach
- File and report naming convention
- Production tolerance and change notification
- Sample validation and project calculation scope
Our RFQ and sample-approval guide helps connect photometry to the approved product.
Final recommendation
Choose IES or LDT according to the project software and market, but judge the file by traceability and accuracy. The best file is the one measured from the exact luminaire, imported correctly and validated against a production-intent sample.
If you send us your required format, product configuration and calculation geometry, we can organise the relevant photometric data and explain its orientation. We will not treat a polar-curve screenshot as a substitute for a usable project file.

